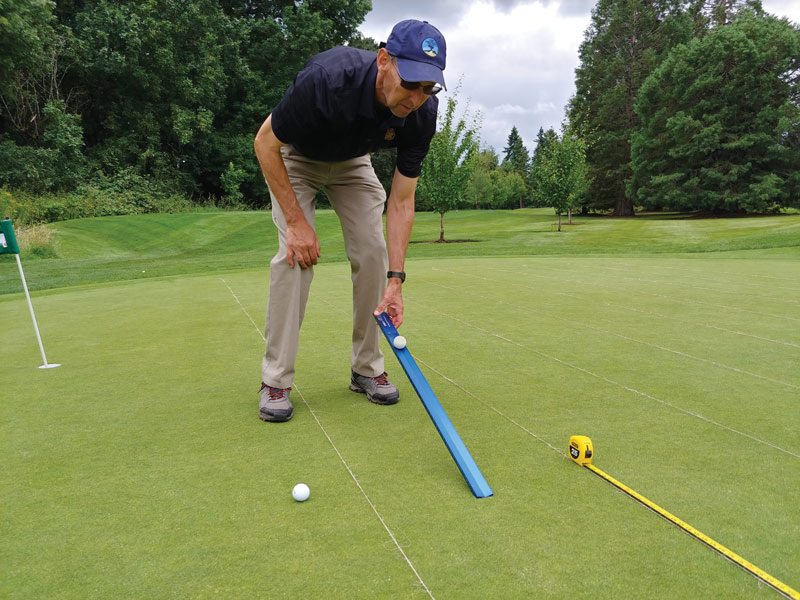
Figure 1. The Stimpmeter was able to quantify differences in putting green ball roll distance when 120 rounds of golf traffic were applied and then compared with non-trafficked control treatments at Royal Oaks Country Club in Vancouver, Wash., on Aug. 1, 2019. Photos by Alec Kowalewski
Golf shoes have often been blamed for affecting surface putting green performance and appearance. Turfgrass scientists have regularly used visual ratings to qualitatively assess the effects of foot traffic (2, 8, 10). Quantitative measures, such as point-intercept counts, shoot density and digital image analysis, have also been used to assess the effects of foot traffic on golf course putting greens and fairways (4, 10). However, significant amounts of traffic are required to produce statistical differences when using these measures as response variables.
Golf course superintendents change hole locations regularly to prevent the accumulation of significant wear over time. Despite these efforts, some golfers are convinced that golf shoes with more aggressive tread design negatively affect surface playing characteristics, increasing the difficulty of making putts for subsequent golfers. Currently there is no record of tools or methods capable of quantitatively assessing playing surface differences produced by shoe type. Also, there are no records of tools capable of quantifying differences in playing characteristics in as little as a single day of golf rounds.
The objective of this experiment was to identify quantitative tools capable of documenting differences in surface performance and appearance produced by different golf shoes during a single day of traffic.
Materials and methods
This research was conducted on a USGA sand-based annual bluegrass (Poa annua L.) practice putting green at Royal Oaks Country Club in Vancouver, Wash. This putting green is mowed at a 0.1-inch (2.8-millimeter) bench height, receives 2.8 pounds nitrogen per 1,000 square feet (13.7 grams/square meter) annually, and is irrigated as needed to maintain a firm, healthy playing surface.
Cultural practices on this green include biannual aerification, typically done with 5/8-inch (15.8-millimeter) (outer diameter) solid tines, as well as weekly verticutting, biweekly topdressing, and venting with needle tines every four to six weeks. Plant growth regulators are also applied during spring and summer for growth and seedhead suppression based on growing degree days.
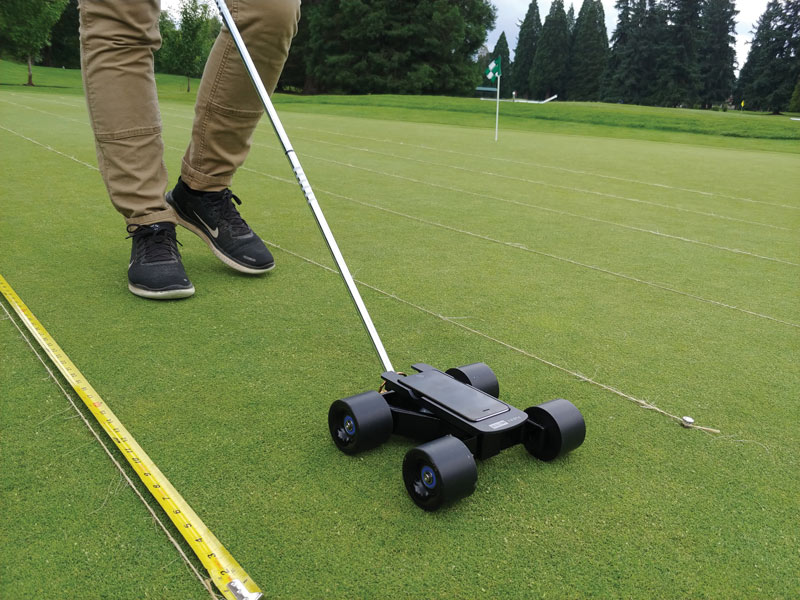
Figure 2. The ParryMeter identified vertical deviation (smoothness) and lateral deviation (trueness) differences between various shoe types after as few as 60 rounds of golf shoe traffic at Royal Oaks Country Club in Vancouver, Wash., on Aug. 1, 2019.
The experimental design was a randomized complete block design with four replications. The single factor in this project was foot traffic applied using three different shoes (numbered 1=least aggressive tread, 2=medium tread and 3=most aggressive tread) and a non-treated control, which did not receive foot traffic. Individual plot size was 35 feet (10.7 meters) by 1 foot (30.5 centimeters) to facilitate the ParryMeter operation protocol. Traffic amounts and timing were derived using methodology defined by Hathaway and Nikolai (3). Traffic was applied for a day on Aug. 1, 2019, with data collected after rates equivalent to 60, 120 and 240 rounds of play.
Response variables, evaluated for their capability of quantifying the effects of foot traffic on putting greens, included golf ball roll distance, vertical and lateral deviation, normalized difference vegetation index (NDVI), percent green cover, and dark green color index (DGCI). Ball roll distance (in feet) was determined using the Stimpmeter, while vertical (smoothness) and lateral deviation (trueness) were determined using the ParryMeter after 60, 120 and 240 rounds of simulated foot traffic.
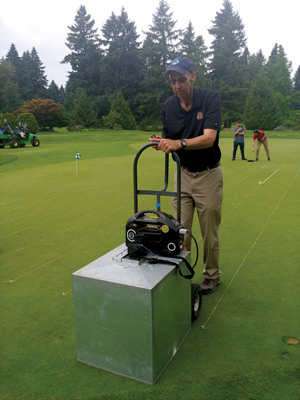
Right: Figure 3. Percent green cover and dark green color index were determined using a photo box. Digital image analysis was not able to identify differences between 240 golf rounds and non-trafficked plots on a putting green at Royal Oaks Country Club in Vancouver, Wash., on Aug. 1, 2019.
After the completion of 240 rounds of simulated foot traffic, NDVI readings and digital images were collected. A CM1000 NDVI meter (Spectrum Technologies, Aurora, Ill.) was used to collect the NDVI readings, and digital images were collected using a photo box according to the procedures developed by Richardson et al. (9). The digital images were analyzed using SigmaScan Pro (Systat Software Inc., San Jose, Calif.) to determine percent green cover (0% to 100%) (9) and DGCI (6). Data were subjected to analysis of variance using SAS 9.4 Proc Mixed (SAS Institute Inc., Cary, N.C.). Fisher’s protected least significant difference (LSD) was used to separate means of significant factors at a 0.05 confidence level.
Results and discussion
The Stimpmeter was able to quantify significant differences between plots that received foot traffic and plots that did not receive foot traffic after 120 and 240 rounds (Table 1, below). Trafficked plots had an average ball roll distance of 12.5 feet (3.8 meters) after 120 rounds, and 12.1 feet (3.7 meters) after 240 rounds, while the non-trafficked control averaged 13.5 feet (4.1 meters). Karcher et al. (7) determined that most golfers can tell the difference in green speed when ball roll differences exceed 12 inches (30.5 centimeters). Considering this, results from this project would suggest that most golfers would be able to detect differences in green speed after as few as 120 rounds when compared with a green without traffic.
While the Stimpmeter was able to quantify differences between trafficked and non-trafficked plots, differences between shoe types were not detected. The Stimpmeter measurements were well over fast for tournament play standards (10.5 feet; 3.2 meters) throughout the duration of the experiment according to Hoss (5). However, a 2010 survey of golfers determined that the majority would rate a green speed of 10.5 feet as slower than fast, suggesting that a roll distance of 12.5 to 13.5 feet (3.8 to 4.1 meters) might be closer to what golfers think is fast (1).
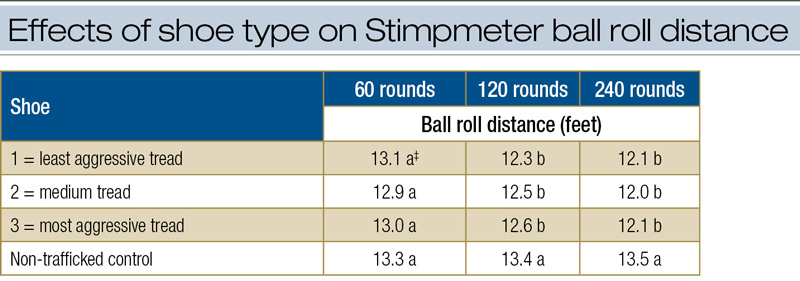
‡Means in the same column followed by the same letter are not significantly different.
Table 1. Effects of shoe type on Stimpmeter ball roll distance (in feet) on an annual bluegrass putting green at Royal Oaks Country Club in Vancouver, Wash., on Aug. 1, 2019.
‡Means in the same column followed by the same letter are not significantly different.
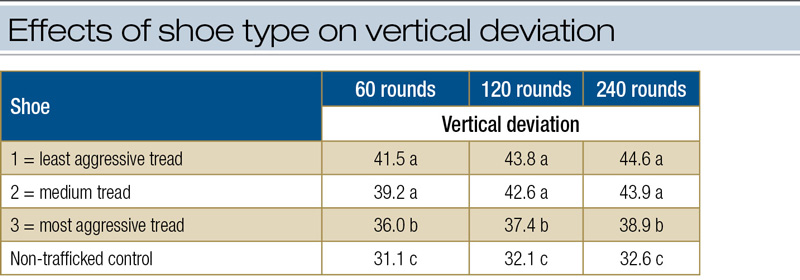
Table 2. Effects of shoe type on vertical deviation (smoothness) measured using the ParryMeter on an annual bluegrass putting green at Royal Oaks Country Club in Vancouver, Wash., on Aug. 1, 2019.
‡Means in the same column followed by the same letter are not significantly different.
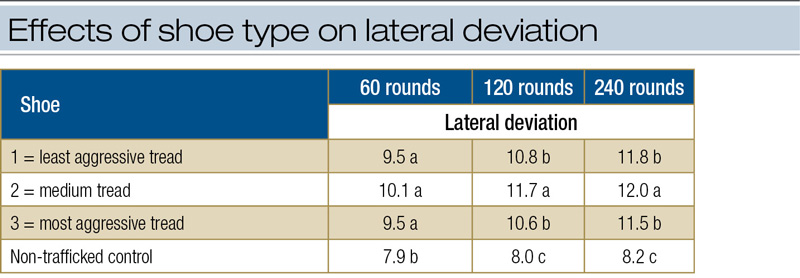
Table 3. Effects of shoe type on lateral deviation (trueness) measured using the ParryMeter on an annual bluegrass putting green at Royal Oaks Country Club in Vancouver, Wash., on Aug. 1, 2019.

‡Means in the same column followed by the same letter are not significantly different.
Table 4. Effects of shoe type on normalized difference vegetation index (NDVI), percent green cover and dark green color index (DGCI) on an annual bluegrass putting green at Royal Oaks Country Club in Vancouver, Wash., on Aug. 1, 2019.
The ParryMeter was able to identify differences in vertical and lateral deviation between treatments receiving foot traffic and control treatments, and differences between shoes after 60, 120 and 240 rounds of simulated foot traffic (Tables 2 and 3, above). Foot traffic had no effect on NDVI, percent green cover or DGCI collected after 240 rounds of simulated foot traffic (Table 4, above). While the ParryMeter was able to detect differences between shoe types with the least amount of traffic (after 60 rounds), the plot size needed for this data collection method (35 linear feet; 10.7 linear meters) is a concern when conducting replicated research. It is important to note that the ParryMeter 2.0 has recently been released, which may have changed the operation protocol for this tool.
Editor’s note: Pin placement software allows superintendents to make more informed decisions on hole locations, which can reduce wear on greens and enhance golfer experience. Learn more in What the Tech? Golf course pin placement.
The Stimpmeter has a similar problem, albeit less, in research design and implementation when using the 1X standard notch (11). In this project, the ball roll distance using the 1X standard notch was 12 to 13.5 feet (3.7 to 4.1 meters), suggesting the minimum plot size would need to be ~14 feet (4.3 meters). A resolution to this problem would be utilizing the 2X alternate notch on the Stimpmeter, which should translate to ball roll distance half the length of the 1X standard notch.
Conclusion
Findings from this project suggest the ParryMeter can detect foot traffic surface disruption with the least amount of traffic, in as little as 60 golf rounds. The ParryMeter was also capable of detecting differences in surface disruption between shoe type. The Stimpmeter was able to detect differences after 120 rounds. However, the Stimpmeter was not able to detect differences between shoe type. NDVI and digital images collected for percent green cover and DGCI were not able to detect differences in comparison to the non-trafficked control after 240 golf rounds in a day.
Acknowledgments
The authors would like to thank Gordon Kiyokawa, CGCS, Royal Oaks Country Club, Vancouver, Wash., for hosting the project.
The research says ...
- The ParryMeter can detect foot traffic surface disruption with the least amount of traffic, in as little as 60 golf rounds.
- The ParryMeter is capable of detecting differences in surface disruption between shoe types.
- The Stimpmeter is able to detect differences after 120 rounds. However, the Stimpmeter is not able to detect differences between shoe types.
- Normalized difference vegetation index (NDVI) and digital images collected for percent green cover and dark green color index (DGCI) are not able to detect differences in comparison with the non-trafficked control after 240 golf rounds in a day.
Literature cited
- Dest, W.M., K. Guillard, S.L. Rackliffe, M.-H. Chen and X. Wang. 2010. Putting green speeds: A reality check! Applied Turfgrass Science (https://doi.org/10.1094/ATS-2010-0216-01-RS).
- Gould, M., A. Kowalewski, C. Mattox, B. McDonald and C. Olsen. 2017. Effects of winter foot traffic on annual bluegrass putting-green quality in western Oregon. Crop, Forage & Turfgrass Management (https://doi.org/10.2134/cftm2016.08.0054).
- Hathaway, A.D., and T.A. Nikolai. 2005. A putting green traffic methodology for research applications established by in situ modeling. International Turfgrass Society Research Journal Annexe 10:69-70.
- Hejl, R.W., B.G. Wherley, R.H. White, J.C. Thomas and C.H. Fontanier. 2016. Deficit irrigation and simulated traffic on ‘Tifway’ bermudagrass summer performance and autumn recovery. Crop Science 56(2):809-817 (https://doi.org/10.2135/cropsci2015.03.0197).
- Hoss, D.D. 1982. The green section’s Stimpmeter: Most think friend - some think enemy. USGA Green Section Record July/Aug:9-10.
- Karcher, D.E., and M.D. Richardson. 2003. Quantifying turfgrass color using digital image analysis. Crop Science 43(3):943-951 (https://doi.org/10.2135/cropsci2003.9430).
- Karcher, D., T. Nikolai and R. Calhoun. 2001. Golfers’ perceptions of greens speeds vary. Golf Course Management 69(3):57-60.
- Nikolai, T.A., and D. Karcher. 2020. Putting green management impact on golf cleat damage. Golfdom 76(10):29-33.
- Richardson, M.D., D.E. Karcher and L.C. Purcell. 2001. Quantifying turfgrass cover using digital image analysis. Crop Science 41(6):1884-1888 (https://doi.org/10.2135/cropsci2001.1884).
- Samaranayake, H., T.J. Lawson and J.A. Murphy. 2008. Traffic stress effects on bentgrass putting green and fairway turf. Crop Science 48(3):1193-1202 (https://doi.org/10.2135/cropsci2006.09.0613).
- United States Golf Association. 2012. Stimpmeter instruction booklet. Retrieved July 5, 2021 (https://www.usga.org/content/dam/usga/pdf/imported/StimpmeterBookletFINAL.pdf).
Alec Kowalewski is an associate professor and turf specialist; Brian McDonald is a research assistant; Emily Braithwaite is a faculty research assistant; Clint Mattox is a postdoctoral scholar; and Alyssa Cain and Steven Tao are graduate students at Oregon State University.