Editor’s note: This research was partially funded by GCSAA through a grant from the GCSAA Foundation.
Managing to alleviate traffic stress on golf course turfgrass can be a constant issue for many golf course superintendents, depending on the number of rounds played and/or current weather conditions. Past scientific research has demonstrated how different types of traffic (for example, foot or vehicular) can cause soil compaction, soil displacement and/or wear damage, which can result in thinning of the turf canopy (decreased turf cover), decreased turf quality, leaf bruising, loss of color, less verdure, matting of the turf and reduced plant density (1, 4, 5).
Golf cart use continues to rise (8), and the area of turf impacted by a golf cart carrying one or two golfers is estimated to be at least 48 times greater than the area affected by foot traffic stress from walking golfers (9). Therefore, golf cart traffic can be challenging for superintendents, especially during suboptimal growing conditions, such as frost, drought and saturated soils after heavy rainfall. For example, during periods of acute summer drought stress, the turfgrass typically continues to receive golf cart or foot traffic, which may compound conditions of drought stress.
Although drought resistance and the recuperative potential of turfgrass species have been investigated extensively (6), little research has investigated the combined effects of drought and traffic stress on turf performance and soil properties. Therefore, research was conducted at Kansas State University in Manhattan, Kan., to evaluate the response in turf canopy performance (2) and impacts on soil properties and turfgrass rooting (3) from golf cart traffic during a simulated drought and subsequent recovery period (without traffic) of four turfgrass species maintained at two mowing heights — golf course fairway and rough.
Our golf cart traffic + drought experiment
Field studies were conducted in 2015 and 2016 at the Rocky Ford Turfgrass Research Center at Kansas State University. The soil was a silty clay loam. A 41-day drought period (that is, no precipitation or irrigation) was simulated under a stationary rainout shelter from June 30 to Aug. 10 in 2015, and again from June 27 to Aug. 7 in 2016, with a subsequent 40-day recovery period with irrigation/precipitation, to investigate the performance and recovery of four turfgrass species subjected to golf cart traffic stress at two golf course mowing heights.
The two cool-season (C3) turfgrass species included were America Kentucky bluegrass (Poa pratensis) and Paragon GLR perennial ryegrass (Lolium perenne), and the two warm-season (C4) turfgrass species included were Sharps Improved I buffalograss (Buchloe dactyloides synonym Bouteloua dactyloides) and Meyer zoysiagrass (Zoysia japonica).
The cool-season and warm-season turfgrasses were each specifically managed according to standard agronomic golf industry procedures. Therefore, fertilization timings and amounts differed between cool-season and warm-season turfgrasses, with cool-season turfgrasses receiving 4 pounds nitrogen/1,000 square feet (19.53 grams/square meter) per year, and warm-season turfgrasses receiving 2 pounds nitrogen/1,000 square feet (9.76 grams/square meter) per year. All four species were maintained at two mowing heights of 0.625 inch (1.59 centimeters) (fairway) and 2.5 inches (6.35 centimeters) (rough).
Traffic consisted of 16 passes per week applied (in straight lines) with an electric golf cart, with supplemental weight to simulate two golfers and equipment, during the 41-day drought period. Control plots received no traffic. By the end of the 41-day drought, a total of 96 traffic passes had occurred on the trafficked plots. To minimize the cumulative traffic effects across years, traffic was applied to different areas of the plots in 2015 and 2016. Recovery was assessed after the drought period, during which no traffic was applied and the turf was kept well watered to promote recovery.
Aboveground turfgrass performance was evaluated with weekly measurements of percent green cover via digital images using a lighted camera box, and with visual turf quality ratings. Soil moisture and turf firmness were measured weekly. Soil compaction before and after the drought treatment was measured by taking soil bulk density and soil penetration resistance measurements in both years. Root measurements were collected immediately after the drought in 2016 to evaluate the effects of drought and traffic on root length density, root surface area, average root diameter and root biomass.
Performance and recovery of turf canopies

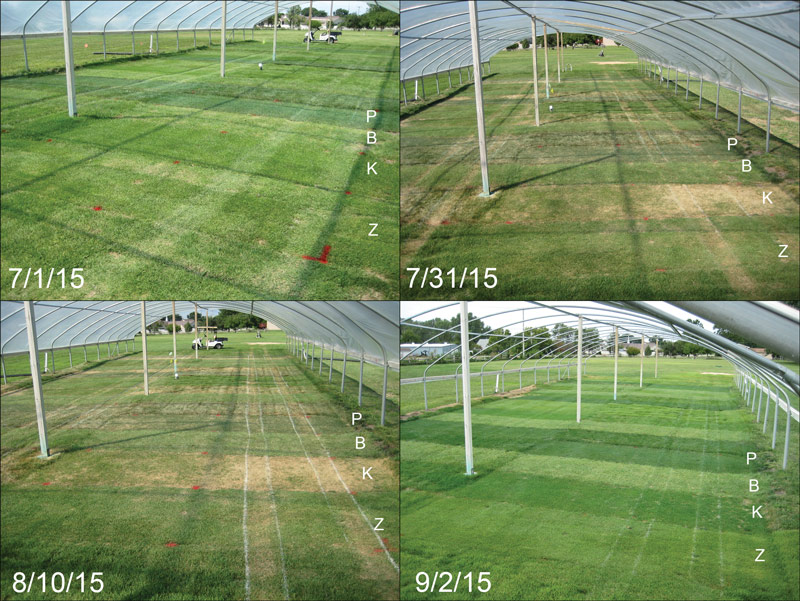
Figure 1. Experimental area under the stationary rainout shelter on July 1, 2015 (1 day of drought + 16 cumulative golf cart traffic passes); July 31, 2015 (32 days of drought + 80 cumulative golf cart traffic passes within the white lines); Aug. 10, 2015 (40 days of drought + 96 cumulative golf cart traffic passes within the white lines); and Sept. 2, 2015 (24 days of recovery). One replication of the research plots of: perennial ryegrass (P), buffalograss (B), Kentucky bluegrass (K) and zoysiagrass (Z) at golf course fairway height (0.625 inch) (foreground) in Manhattan, Kan. Areas outside the white lines received no golf cart traffic. Photos by Ross Braun
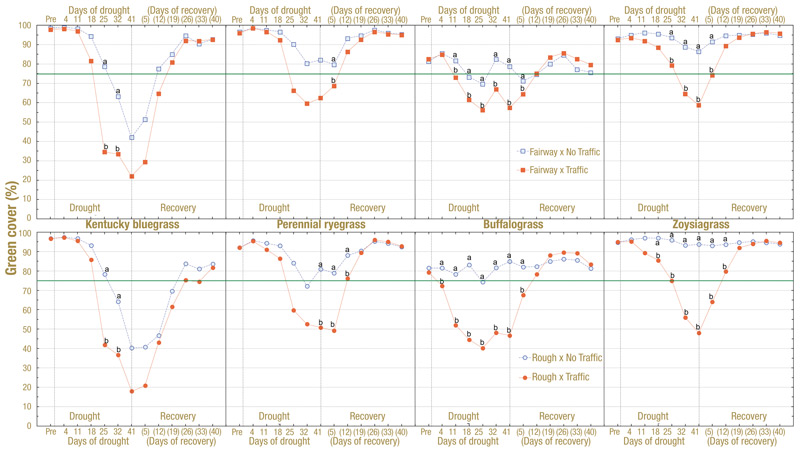
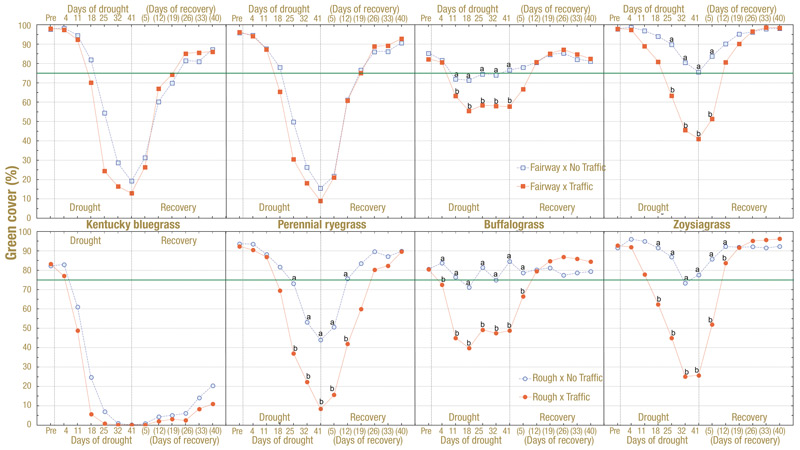
Prior to the drought period each year, all plots were at similar levels of green cover and turf quality (Figure 1). However, traffic stress applied during drought resulted in different responses in green cover, not only within each mowing height (across turf species), but also within each species (between mowing heights) during the drought and the following recovery period (Figures 2, 3, below). Measurements of green cover and turf quality showed similar trends among treatments, so only green cover is shown here [for turf quality results, see (2)].
Drought-stress tolerance
In both years, dates with statistical differences between traffic treatments within each mowing height occurred more often in the warm-season turfgrasses (buffalograss and zoysiagrass) than in the cool-season turfgrasses (Kentucky bluegrass and perennial ryegrass) (Figures 2, 3, below). This does not imply, however, that warm-season turfgrasses had less traffic tolerance. Rather, it is more likely that the better drought-stress tolerance of the warm-season turfgrasses resulted in more green cover in non-trafficked warm-season turfgrass plots under both mowing heights. Meanwhile, the lower drought-stress tolerance of cool-season turfgrasses resulted in similar (low) green cover in both trafficked and non-trafficked plots within each mowing height as the drought progressed, and thus there were fewer dates with statistical differences in green cover and turf quality.
% green cover, 2015
Click on image to enlarge:

Figure 2. Comparison of green cover (%) between traffic treatments divided by turf species, mowing height (0.625-inch fairway, top; 2.5-inch rough, bottom) and date in 2015. During drought, traffic was applied once weekly (16 golf cart passes), and the areas received no further traffic to assess turf recovery. Solid horizontal green line signifies a benchmark of 75% green cover for discussion purposes. At each date within each mowing height of each turf species, means with a common letter or no letters are not significantly different.
% green cover, 2016
Click on image to enlarge:

Figure 3. Comparison of green cover (%) between traffic treatments divided by turf species, mowing height (0.625-inch fairway, top; 2.5-inch rough, bottom) and date in 2016. During drought, traffic was applied once weekly (16 golf cart passes), and the areas received no further traffic to assess turf recovery. Solid horizontal green line signifies a benchmark of 75% green cover for discussion purposes. At each date within each mowing height of each turf species, means with a common letter or no letters are not significantly different.
Our results indicate that if traffic stress continues during acute drought, there is less likelihood of observing a noticeable difference between trafficked and non-trafficked areas in cool-season turfgrasses compared with warm-season turfgrasses. However, if traffic is applied to cool-season turfgrasses during drought stress, green cover and turf quality will nevertheless decrease faster than if traffic had not been applied.
Effect of mowing height
In both years, there was a larger separation in green cover between traffic treatments at the rough mowing height than at the fairway mowing height within each turfgrass species (Figures 2-4). This may have occurred because the rough mowing height has more leaf area than the fairway mowing height, which could result in more water loss in the rough and increase its susceptibility to drought stress compared with the fairway.
For example, compared with respective non-trafficked plots, traffic in fairway plots reduced green cover by 26% in warm-season turfgrasses but did not statistically affect green cover in cool-season turfgrasses at the end of the drought. However, traffic in rough plots reduced green cover by 33% in cool-season turfgrasses (excluding Kentucky bluegrass in 2016) and 43% in warm-season turfgrasses (Figures 2, 3). Therefore, traffic stress during a drought period will accelerate the decline in green cover and quality, which may be more apparent on higher-mowed turfgrass, and superintendents therefore may need to monitor and manage traffic more closely in rough than in fairway areas during dry periods.

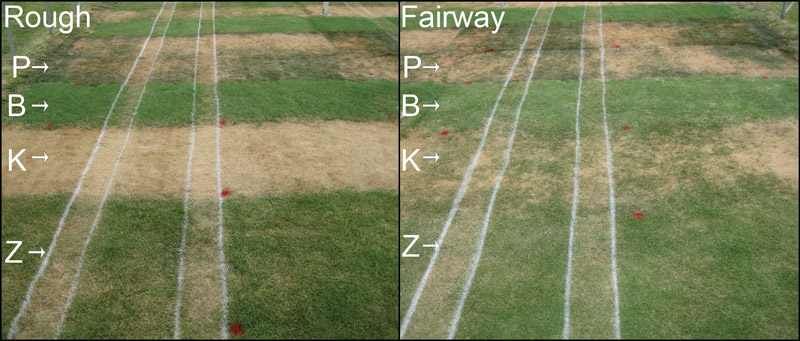
Figure 4. One replication of the research plots in Manhattan, Kan., on Aug. 4, 2016 (39 days of drought + 96 cumulative golf cart traffic passes within the white lines). Plots included perennial ryegrass (P), buffalograss (B), Kentucky bluegrass (K) and zoysiagrass (Z) at golf course rough height (2.5 inches; 6.3 centimeters) (left) and golf course fairway height (0.625 inch; 1.6 centimeters) (right). Areas outside the white lines received no golf cart traffic.
At the end of the 41-day drought in both years, turf plots with the numerically highest green cover and quality within each mowing height were most often the two warm-season turfgrasses, regardless of traffic treatment (Figures 2, 3).
Although there were instances (the 2015 drought period) when trafficked perennial ryegrass was in a similar range of green cover as the two trafficked warm-season turfgrasses at each respective mowing height at the end of the drought, our results overall demonstrated the importance of using turfgrass species and/or cultivars with better known drought tolerance.
Traffic vs. no traffic
At the start of the recovery period, green cover quickly increased after irrigation began (Figures 1-3). While traffic was not applied to any plots during the 40-day recovery period, “trafficked” and “non-trafficked” treatments are still a point of discussion during the recovery to illustrate lingering effects of traffic applied during drought on the recovery of the turf.
In both years, more dates with statistical differences occurred between traffic treatments within the warm-season turfgrasses in the recovery period because of the larger separations in green cover that developed during the drought period for the reasons discussed above. Regardless, compared with cool-season grasses, warm-season turfgrasses had better drought tolerance, resulting in higher green cover and turf quality at the end of drought in both non-trafficked and trafficked treatments, which, in turn, led to faster recovery to acceptable quality and >75% green cover (Figures 2, 3).
Across both years, trafficked warm-season turfgrasses averaged 12 days to recover to 75% green cover, while non-trafficked warm-season turfgrass plots were already above 75% green cover at the start of the recovery. In contrast, across both years, trafficked cool-season turfgrasses averaged 23 days to recover to 75% green cover, while non-trafficked cool-season turfgrasses averaged 18 recovery days.
Further research is needed on the combined effects of drought and traffic stress in additional turfgrass species and with additional mowing heights, various intensities, and various types of traffic application. Also needed are long-term studies of drought and traffic in several consecutive years, with longer acute drought periods, or with traffic during recovery periods.
Soil and root properties
Turf firmness
As soil moisture declined during the drought, the turf surface of all four turf species became more firm (harder), especially at the lower (fairway) mowing height (3) (data shown in reference). This effect was intensified by traffic, especially at the rough mowing height. Turf firmness may affect playability or the safety of the surface; therefore, it is important to consider during drought. Soil moisture was consistently highest in buffalograss among species during the 41-day drought in both years. The ability of buffalograss to maintain higher soil moisture during drought may have helped it stay green longer than the other species.
Soil compaction
No consistent differences in soil compaction were observed among turf species or between mowing heights or traffic treatments. This is likely because the dry soil during the drought was relatively hard anyway, and the traffic did not compress it. Therefore, traffic on turf during drought may not significantly compact the soil.
There were a few differences in rooting among species in the top 12 inches (30.48 centimeters) of soil [data not shown; see (3)]. More specifically, the warm-season turfgrasses and perennial ryegrass had larger root diameters, which may have led to greater capabilities of exploring large volumes of soil and thus improved their drought performance. Overall, the minimal differences in rooting were not closely related to turf quality and green cover (described above). We might have seen a closer relationship between rooting characteristics and turf canopy performance if we had been able to measure roots below 12 inches. Further research is needed on this topic.
Editor’s note: Your soil is teeming with trillions of organisms essential to plant health. Get to know this subterranean cast, how the various microbes keep grass green and growing, and how you can support them in Soil microorganisms: A turf manager’s guide.
Overall, most differences in soil and roots were caused by drought and not traffic stress, because the traffic treatments did not compact the soil or affect the roots. Therefore, turf managers may see minimal impacts on soil and root characteristics from traffic during drought. However, further research is recommended to attain a better understanding of the combined effects of drought and traffic stress on soil and root responses of additional turfgrass species.
The take-home message
Results indicate that superintendents may see minimal impacts on belowground variables, such as soil compaction and rooting, but they still need to be aware of the detrimental effects of traffic on the turf canopy during acute drought periods. Cool-season grasses will likely decline in green cover and turf quality faster than warm-season grasses, and traffic and poorer drought tolerance will accelerate this decline. Conversely, because warm-season grasses have better drought tolerance and will generally remain green longer during drought, the detrimental effects of traffic may be more noticeable than in cool-season turfgrasses.
Overall, our results demonstrated that buffalograss and/or zoysiagrass are good choices for golf course fairways and roughs in hot, arid climates and in other locations where acute summer drought may be more prevalent, such as the southern United States or the transition zone. It is important to continue to use more drought-tolerant turf species (that is, warm-season turfgrasses) and/or cultivars whenever possible. Regardless of turf species selection, superintendents need to carefully monitor golf cart traffic during periods of drought, especially on higher-mowed golf course areas that are often less intensively managed but still receive cart traffic.
During periods of severe or prolonged summer drought stress, superintendents may need to consider various methods of managing cart traffic: (a) reducing traffic intensity by rotating or spreading out areas available to cart traffic; (b) concentrating cart traffic to specific entrances and exits from the fairway (which may increase traffic damage), but in more localized areas that can later be renovated; (c) directing traffic to stay in the fairway to reduce traffic in the rough; (d) using stakes, ropes and signs to direct or deter traffic; or (e) restricting golf cart traffic to “cart path only,” just as “cart path only” is implemented during periods of below-optimal growing conditions (for example, frost or saturated soils after heavy rainfall).
If traffic can be properly managed during drought, areas that are the slowest to lose green cover will typically be the fastest to recover after the drought ends. Continual communication with the board, members and golfers will help keep everyone informed on the importance of managing or potentially limiting traffic during times of drought or other stress.
Funding
This work was supported by GCSAA through a grant from the GCSAA Foundation and by the Kansas Turfgrass Foundation.
Acknowledgments
The authors want to express their gratitude to Nicholas Bloedow for statistical assistance and the late Cliff Dipman for assistance with this project. The full manuscripts on the experiment are available online. “Part I. Performance and recovery of turf canopies” was published in Crop Science (https://doi.org/10.1002/csc2.20324). “Part II. Soil moisture, soil compaction, and rooting” was first published online on March 25, 2021 (https://doi.org/10.1002/its2.62) in the International Turfgrass Research Society Journal. The fully edited version of Part II will be published at a later date and will be available via the same URL.
The research says ...
- Golf cart traffic during drought accelerates leaf injury, which varies among turf species and mowing heights.
- Warm-season turfgrasses maintained higher green cover and quality during summer drought and recovered faster than cool-season turfgrasses.
- Traffic stress during acute drought periods is more apparent on turfgrass mowed at rough (higher) heights than at fairway (lower) heights.
- Decreased soil moisture caused by drought minimized the detrimental effects of traffic on soil compaction and rooting.
Literature cited
- Beard, J.B. 1976. Turfgrass wear. USGA Green Section Record 14(4):10-12 (https://gsr.lib.msu.edu/1970s/1976/760710.pdf).
- Braun, R.C., D.J. Bremer and J.A. Hoyle 2020. Simulated traffic on turfgrasses during drought stress. I. Performance and recovery of turf canopies. Crop Science (https://doi.org/10.1002/csc2.20324).
- Braun, R.C., D.J. Bremer and J.A. Hoyle. 2021. Simulated traffic on turfgrasses during drought stress. II. Soil moisture, soil compaction, and rooting. International Turfgrass Society Research Journal (https://doi.org/10.1002/its2.62). In press.
- Canaway, P.M. 1981. Wear tolerance of turfgrass species. The Journal of the Sports Turf Research Institute 57:108-121.
- Carrow, R.N., and B.J. Johnson. 1996. Turfgrass wear stress: Effects of golf car and tire design. HortScience 31(6):968-971 (https://doi.org/10.21273/HORTSCI.31.6.968).
- Fry, J., and B. Huang. 2004. Applied turfgrass science and physiology. John Wiley & Sons, Hoboken, N.J.
- Karcher, D.E., M.D. Richardson, K. Hignight and D. Rush. 2008. Drought tolerance of tall fescue populations selected for high root/shoot ratios and summer survival. Crop Science 48(2):771-777 (https://doi.org/10.2135/cropsci2007.05.0272).
- Moeller, A. 2014. Golf carts — profit center or not? USGA Green Section Record 52(7):1-10 (https://gsr.lib.msu.edu/2010s/2014/2014-04-04.pdf).
- Wienecke, D. 2004. Letting the numbers tell the story on cart damage. USGA Green Section Record 42(2):11-14 (https://gsr.lib.msu.edu/2000s/2004/041111.pdf).
Ross C. Braun is a lead research scholar in the Department of Horticulture and Landscape Architecture at Purdue University, West Lafayette, Ind. Dale J. Bremer is a professor in the Department of Horticulture and Natural Resources at Kansas State University, Manhattan, Kan. Jared A. Hoyle is a turf and ornamental territory manager at Corteva Agriscience, Manhattan, Kan.